The ERD (Entity-Relationship Diagram) viewer draws your schema's tables and their relationships as an interactive diagram. This chapter explains how to read it, and how to add your own visual notes: zones and virtual relations.
Contents
1. Opening the diagram
Right-click a schema and choose View Diagram (see Chapter 3), or use the same action from a single table's context menu to open a diagram scoped to just that table.
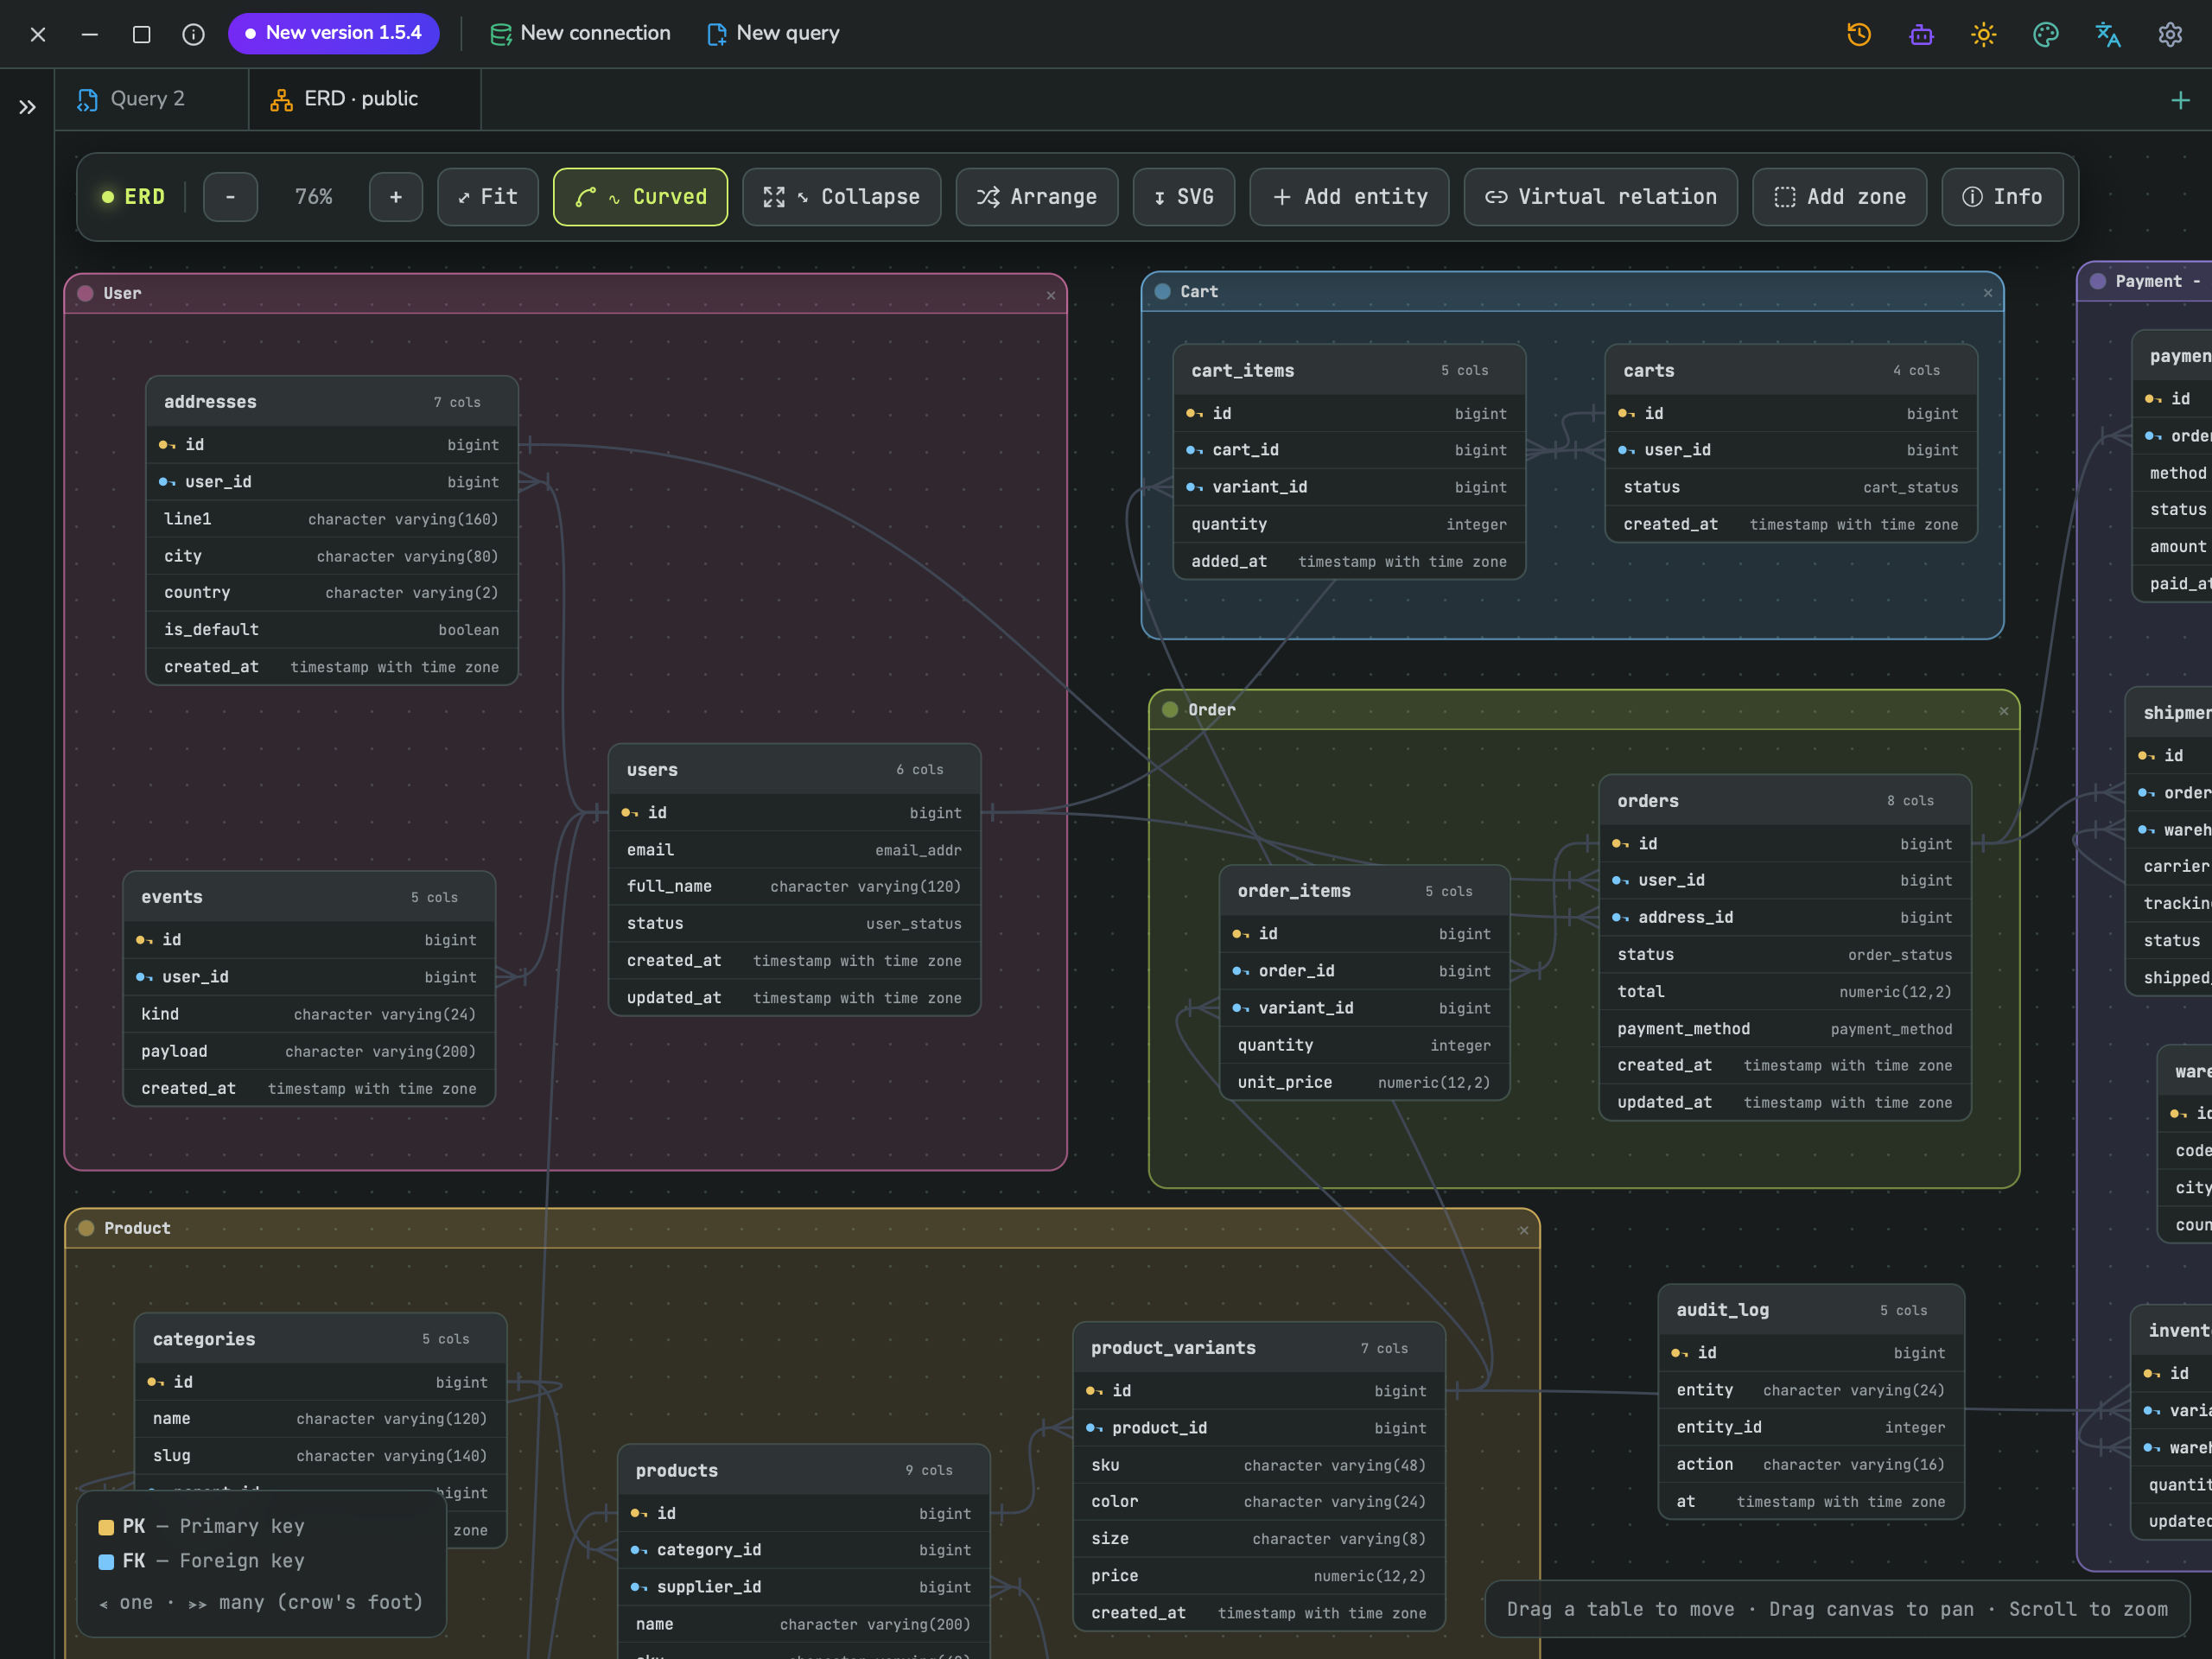
- Pan — drag an empty area of the canvas.
- Zoom — scroll, or use the − / + buttons / percentage in the toolbar.
- Move a table — drag its box.
- Fit — click Fit in the toolbar to fit the whole diagram back into view.
2. Reading an entity box
Each table is drawn as a box with its name and column count in the header, then one row per column:
- A small key icon marks a primary key column.
- A small link icon marks a foreign key column.
- Lines between boxes use crow's-foot notation: a single tick means "one", a three-pronged fork means "many".
A legend in the bottom-left corner of the canvas always reminds you of these symbols.
3. Viewing a table's DDL from the diagram
Click the Info button in the toolbar, then click any table, to open a side panel with that table's raw CREATE TABLE and ALTER TABLE ... FOREIGN KEY statements:
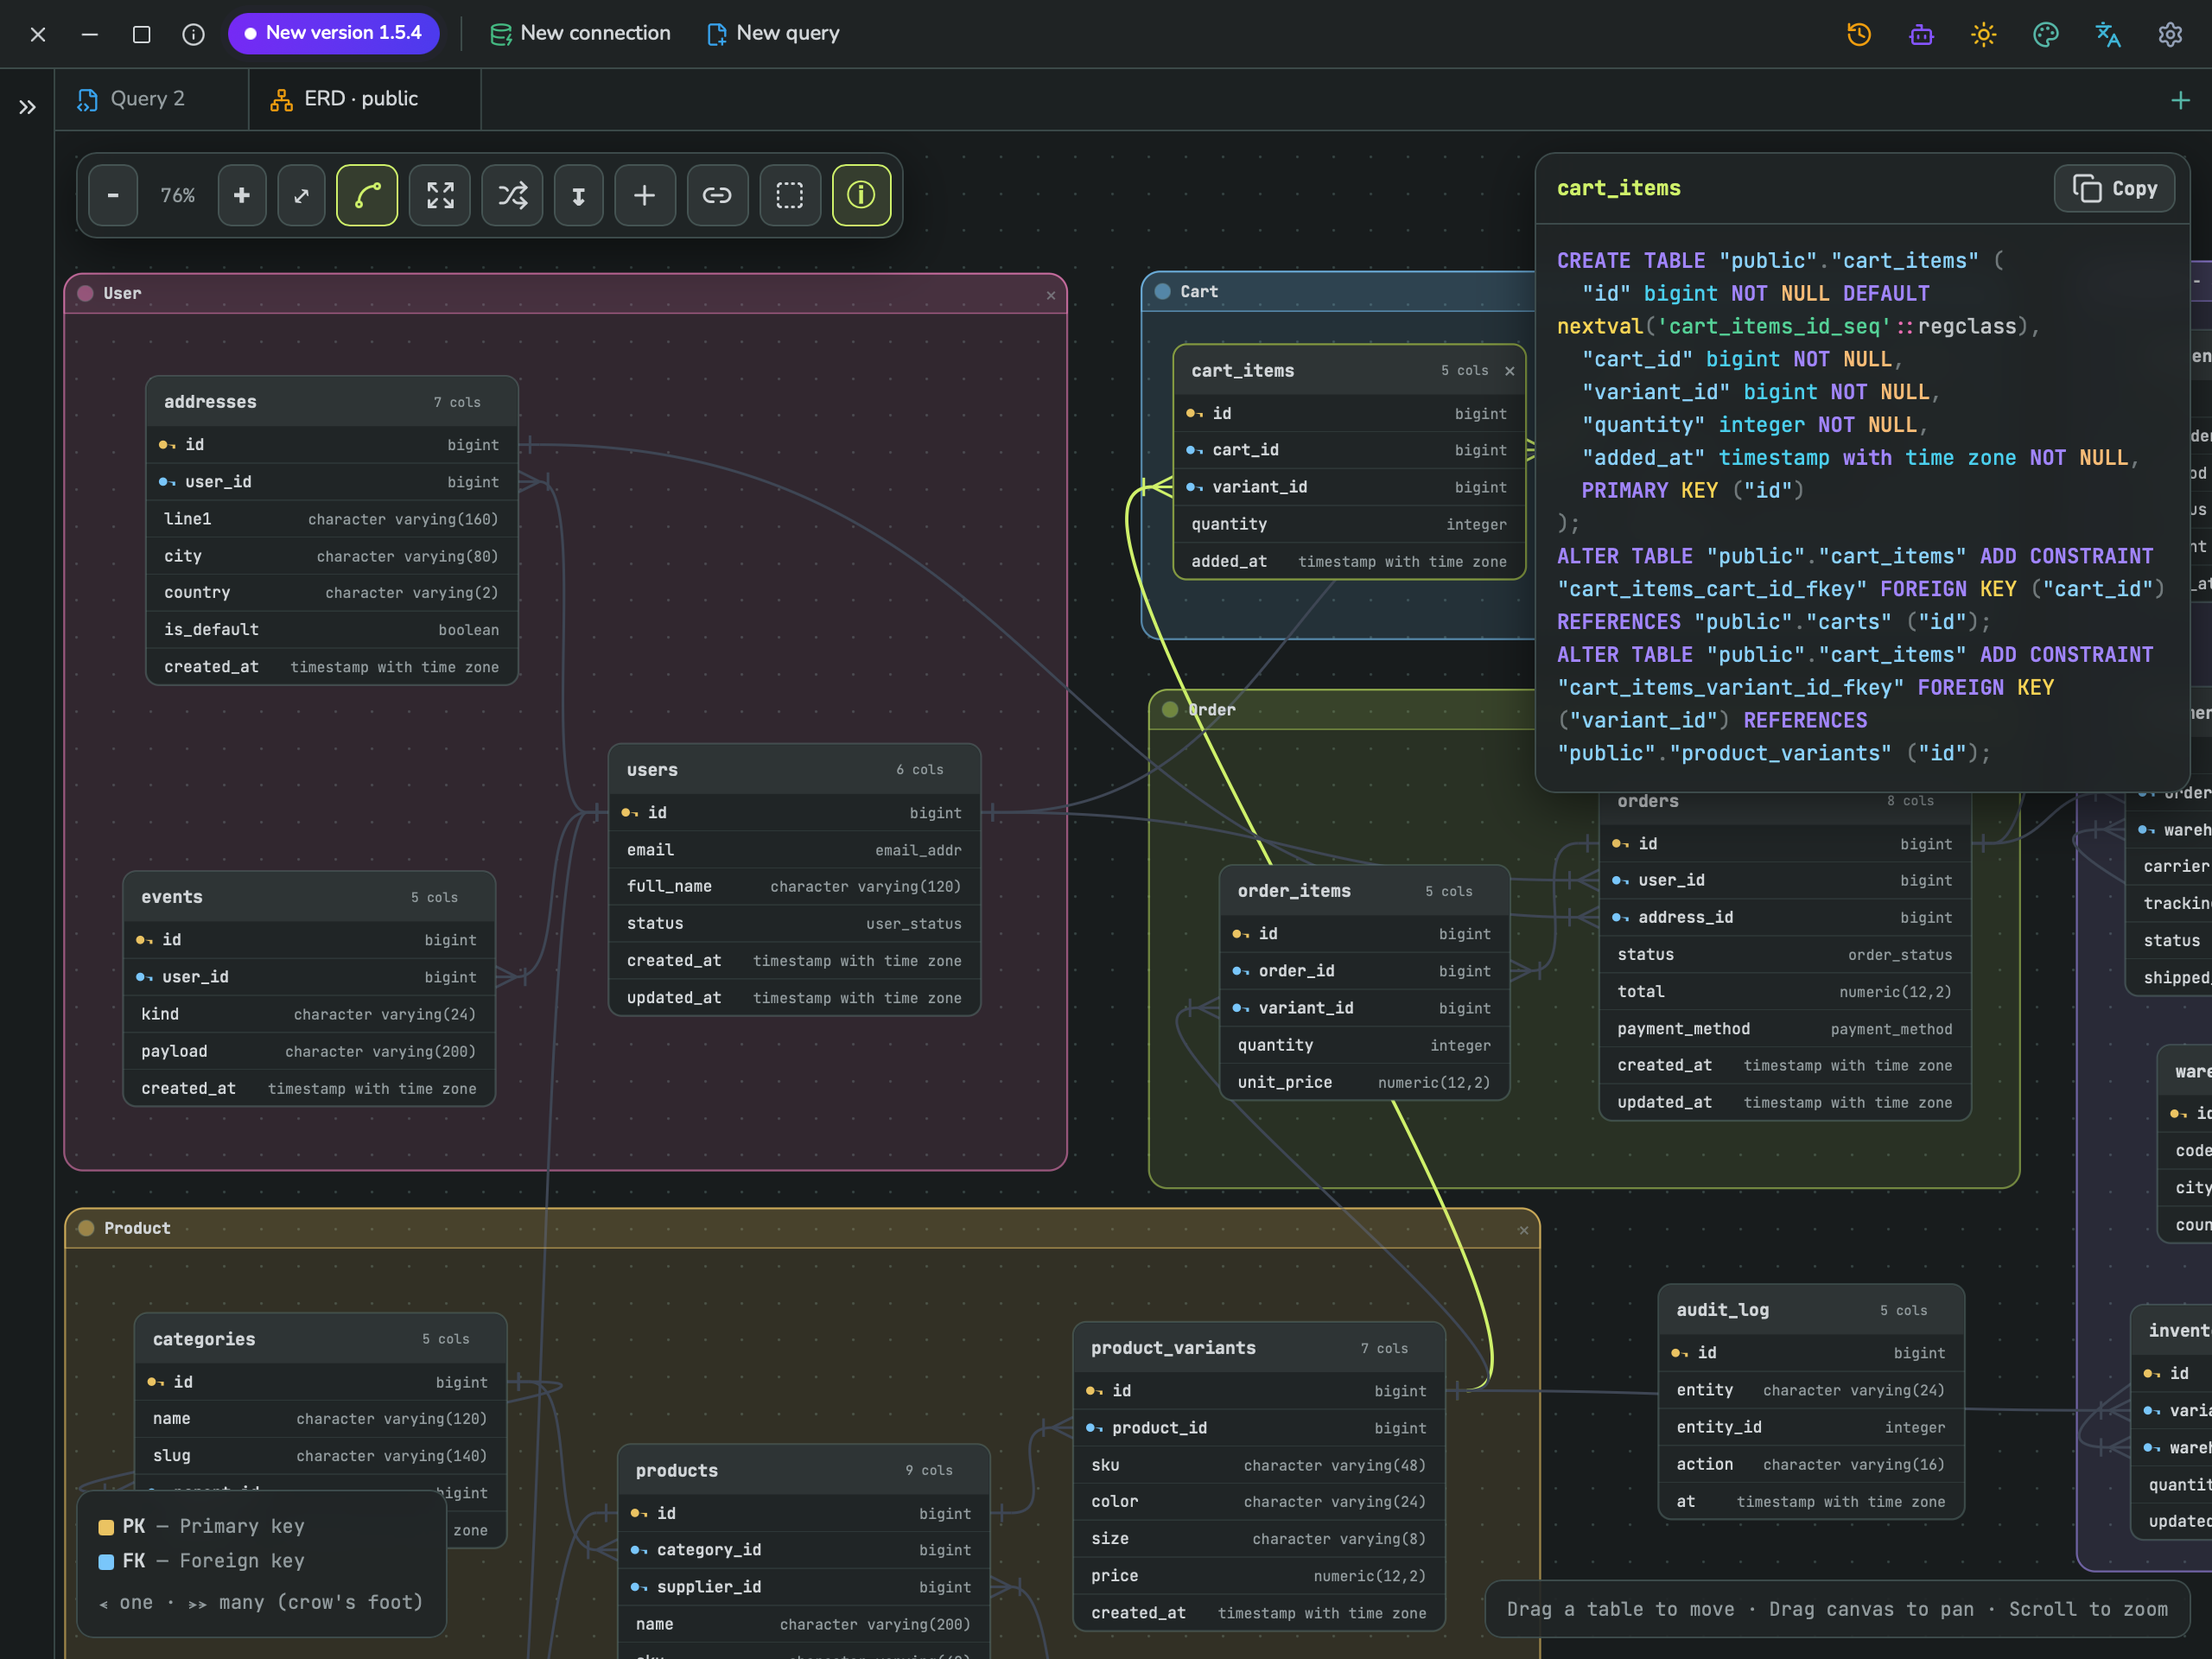
Selecting a table this way also highlights its relationship lines on the canvas, so you can see at a glance which other tables it connects to. Click Copy DDL to copy the statements to your clipboard.
4. Grouping tables with zones
A zone is a colored, named rectangle you draw on the canvas to visually group related tables — for example, all tables belonging to "Orders". Zones are a diagram-only tool: they do not change your database in any way.
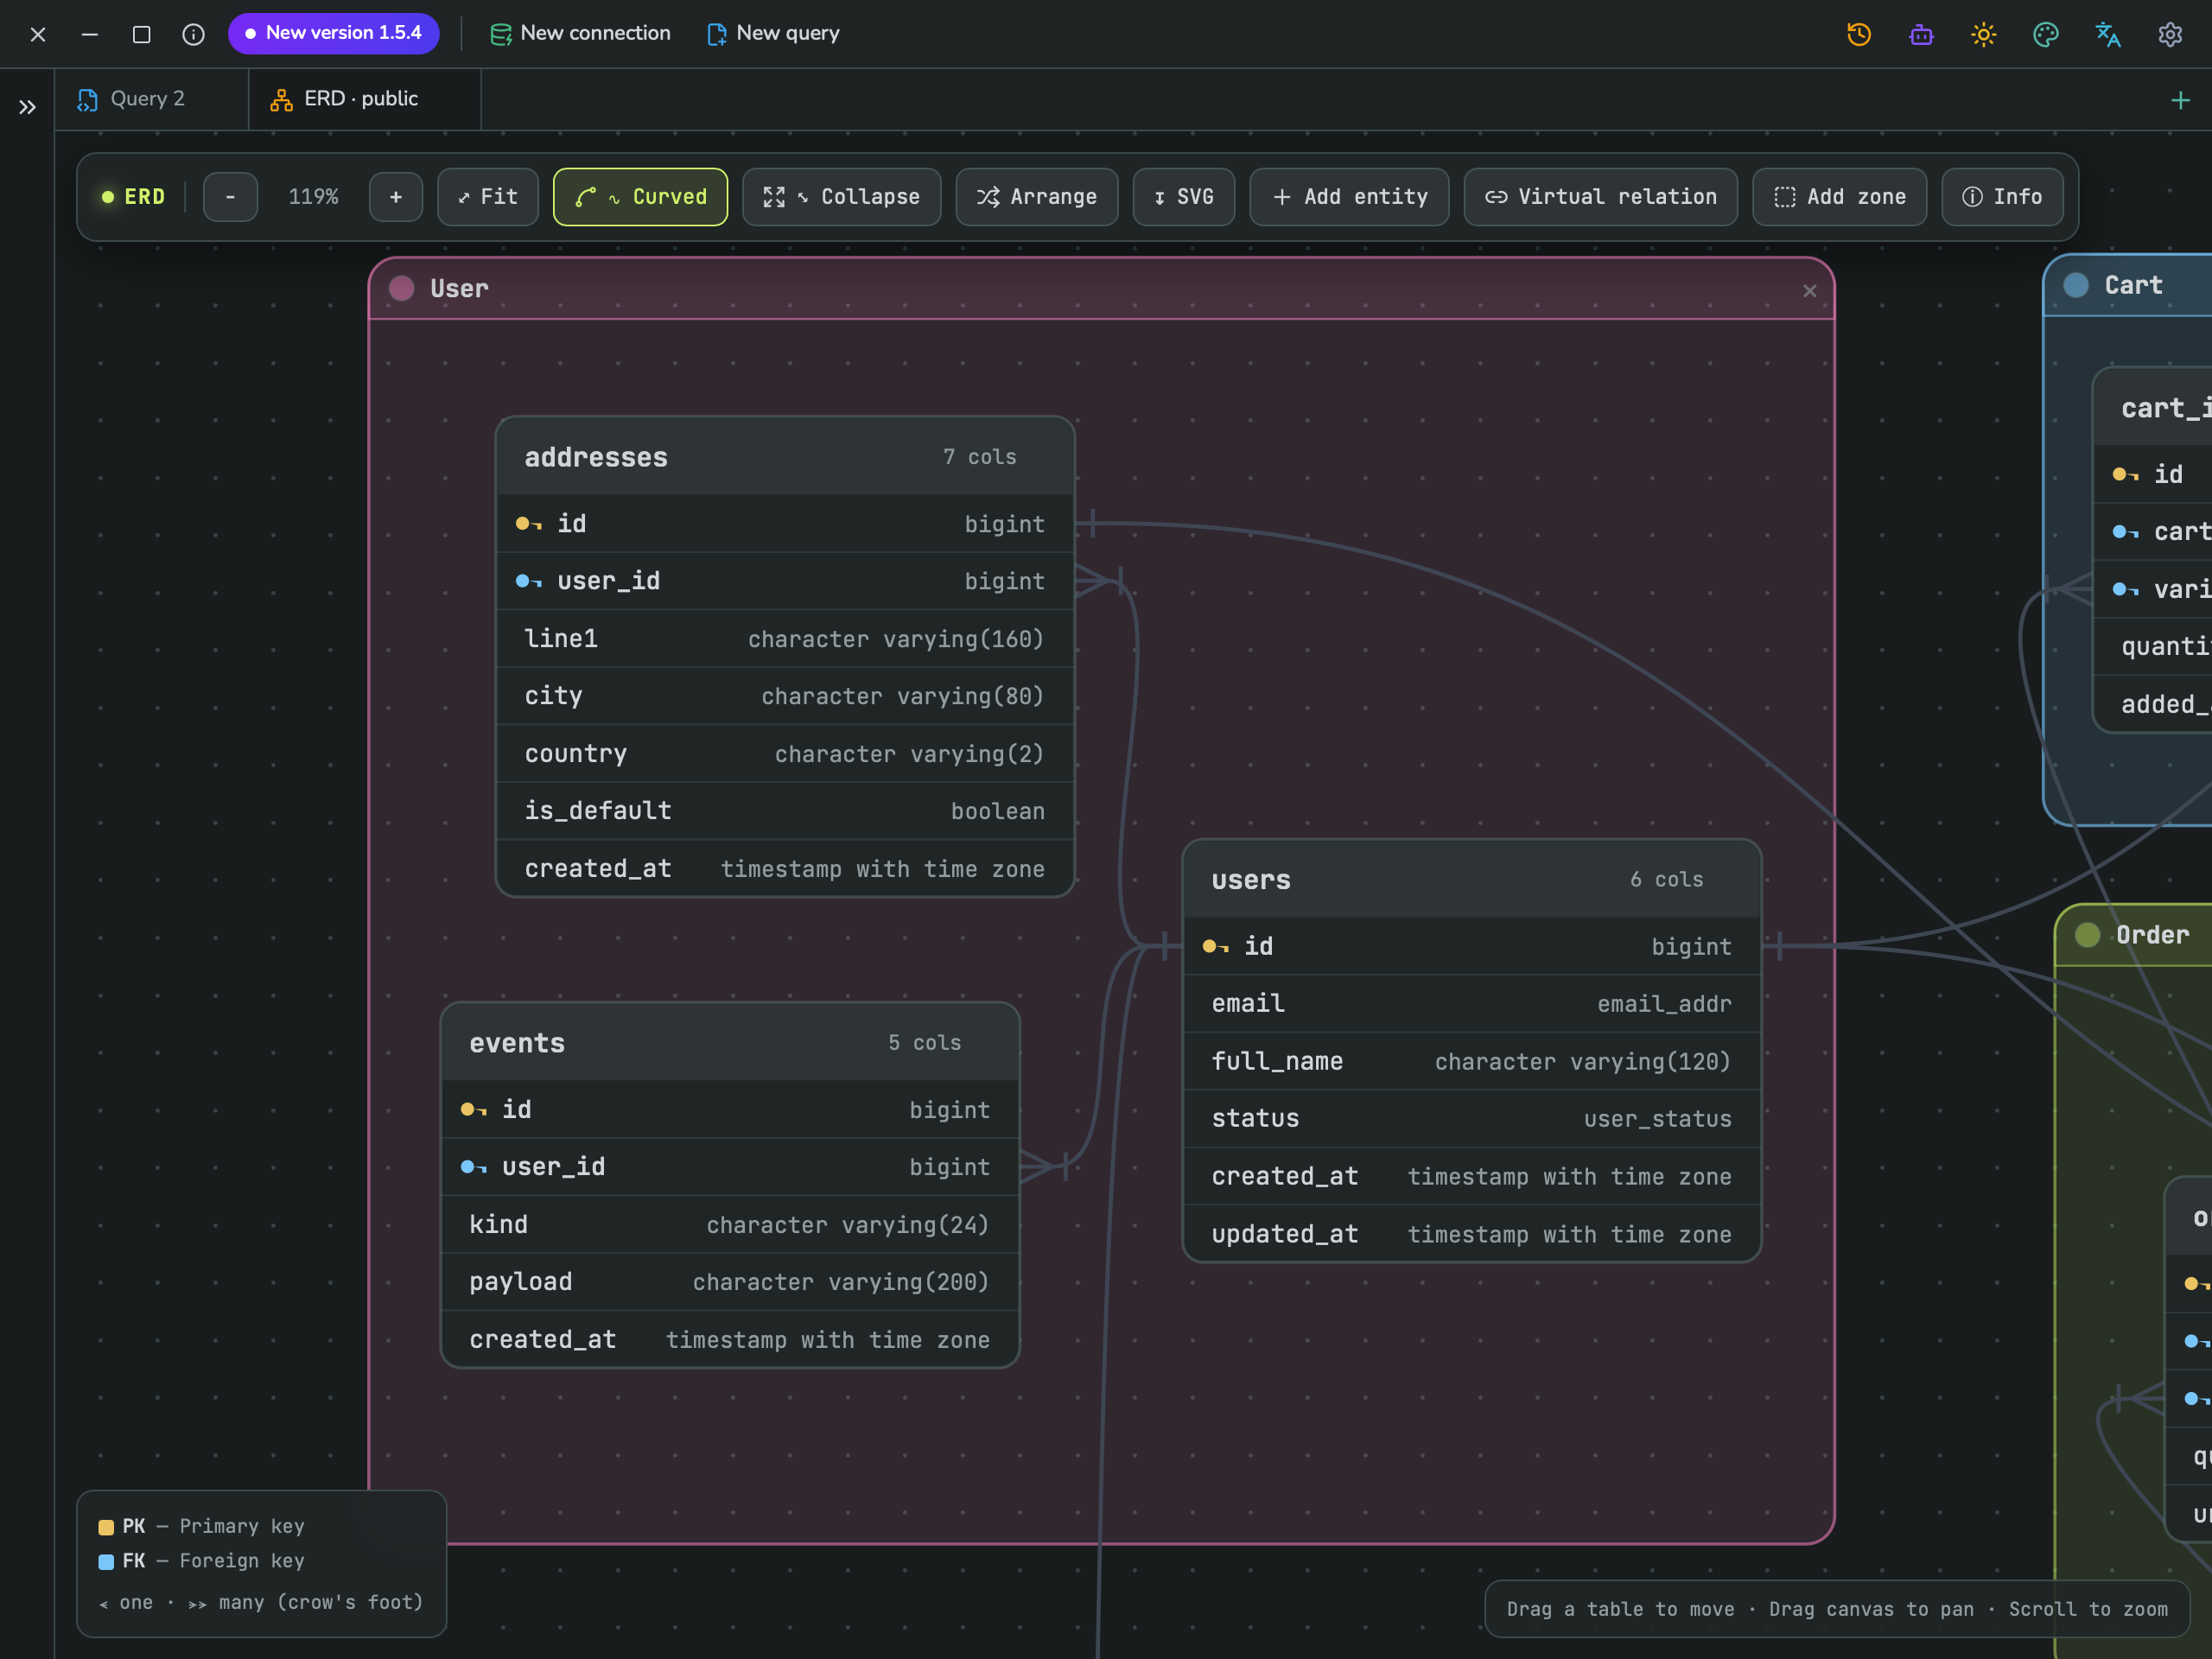
To create a zone:
- Click Add zone in the toolbar.
- Drag on the canvas to draw the zone's rectangle (press Esc to cancel).
- Double-click the zone's header to rename it, or click its color dot to change its color.
- Drag the zone's header to move it — every table whose center is inside the zone moves along with it.
Click the × on a zone's header to delete the zone. This only removes the grouping box; the tables inside are kept exactly as they were.
5. Adding a virtual relation
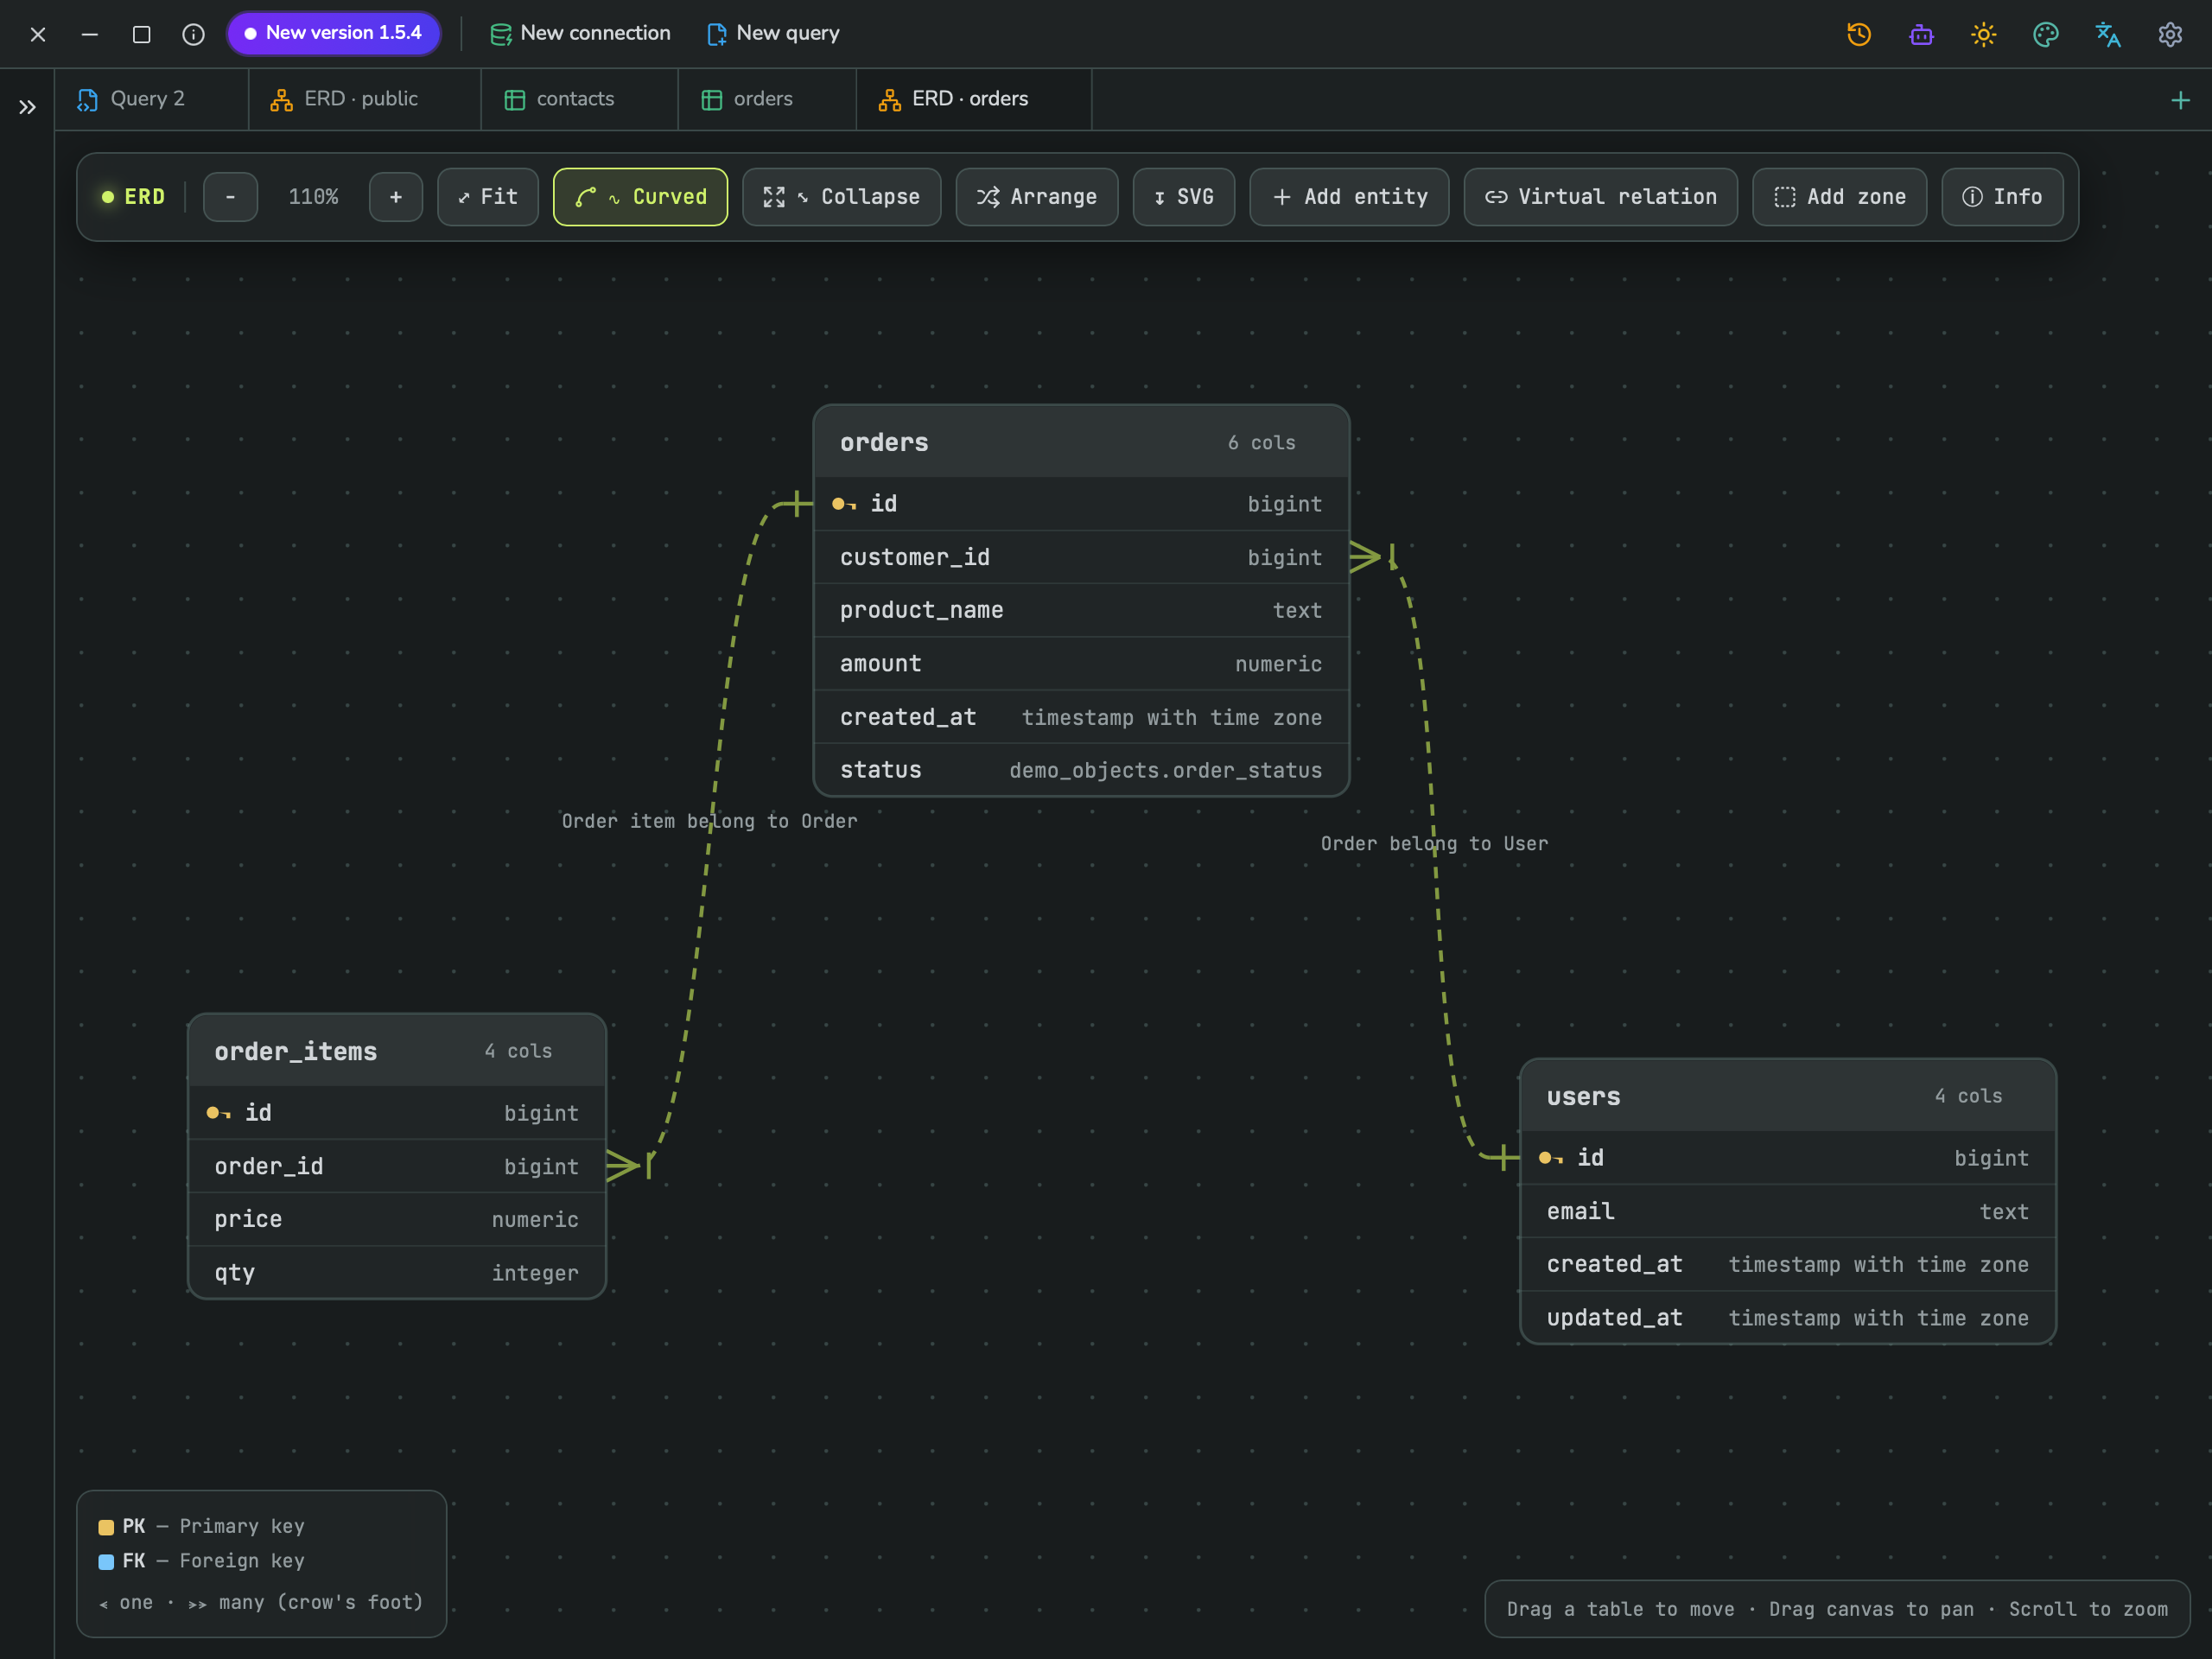
A virtual relation is a relationship line you define yourself between two columns, for diagram purposes only — useful when two tables are logically related but not connected by a real foreign key in the database (for example, a polymorphic reference, or a link across two different schemas).
Click Virtual relation in the toolbar to open the dialog:
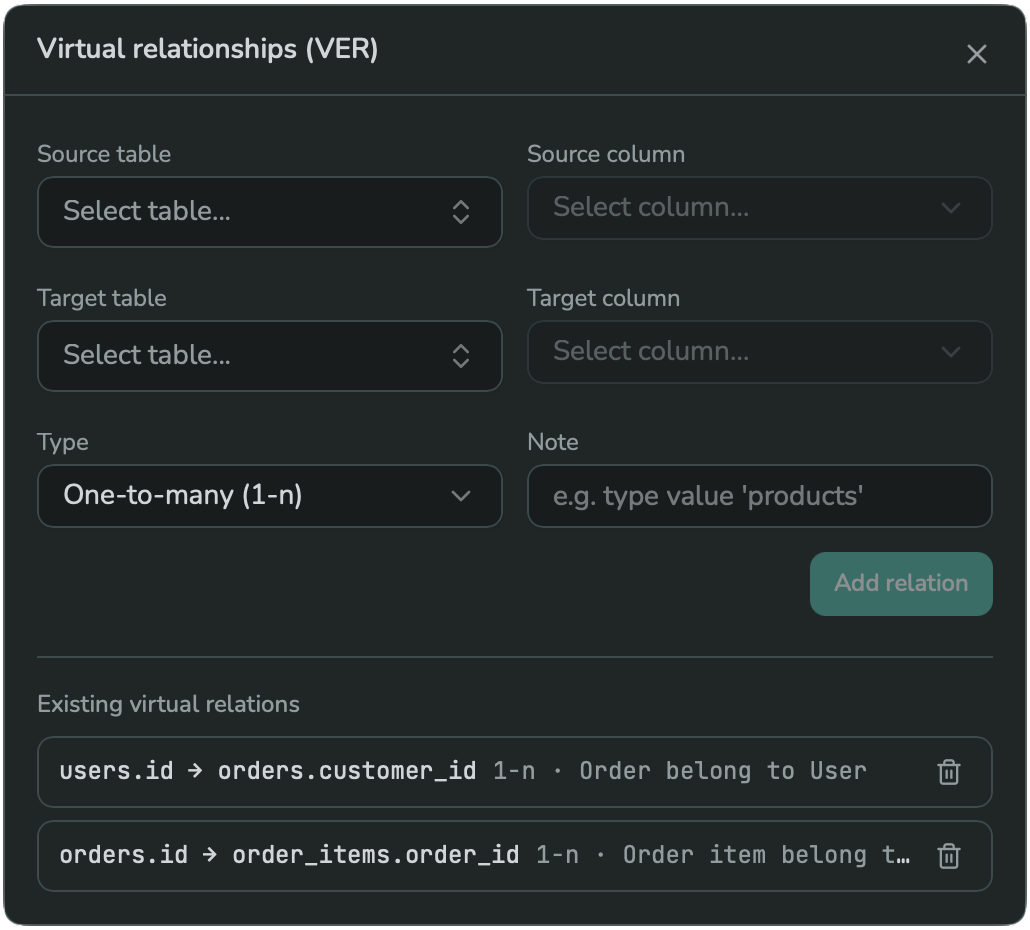
- Choose a Source table and Source column.
- Choose a Target table and Target column.
- Choose a Type: One-to-many (1-n) or One-to-one (1-1).
- Optionally, type a Note describing the relationship (for example, "Order belongs to User").
- Click Add relation.
Existing virtual relations are listed below the form, each with a delete (trash) icon.
Virtual relations are drawn as dashed lines, with your note as a label, so they are always visually distinct from real foreign-key lines (which are solid and unlabeled):
6. Expanding and collapsing entities
Some tables have long column names or type names that get cut off in a narrow box. Click Expand all / Collapse all in the toolbar to widen or narrow every table box at once, so text is never truncated (Expand) or so the diagram takes less space (Collapse). You can also double-click a single table's header to expand or collapse just that one table.
7. Toolbar reference
| Button | What it does |
|---|---|
| − / percentage / + | Zoom out / current zoom level / zoom in |
| Fit | Fit the whole diagram into the visible canvas |
| Curved / Straight | Toggle the line style used for relationship edges |
| Expand all / Collapse all | Widen or narrow every table box (see section 6) |
| Arrange | Automatically re-arrange tables; click again to cycle through layouts |
| SVG | Export the current diagram as an SVG file |
| Add entity | Add a table that is not yet on the diagram |
| Virtual relation | Open the virtual relation dialog (see section 5) |
| Add zone | Draw a new zone (see section 4) |
| Info | Toggle the DDL panel (see section 3) |